Review for Test on Monday (701) /Tuesday (715/716)
7.sp.1,2,3,4
Test Review
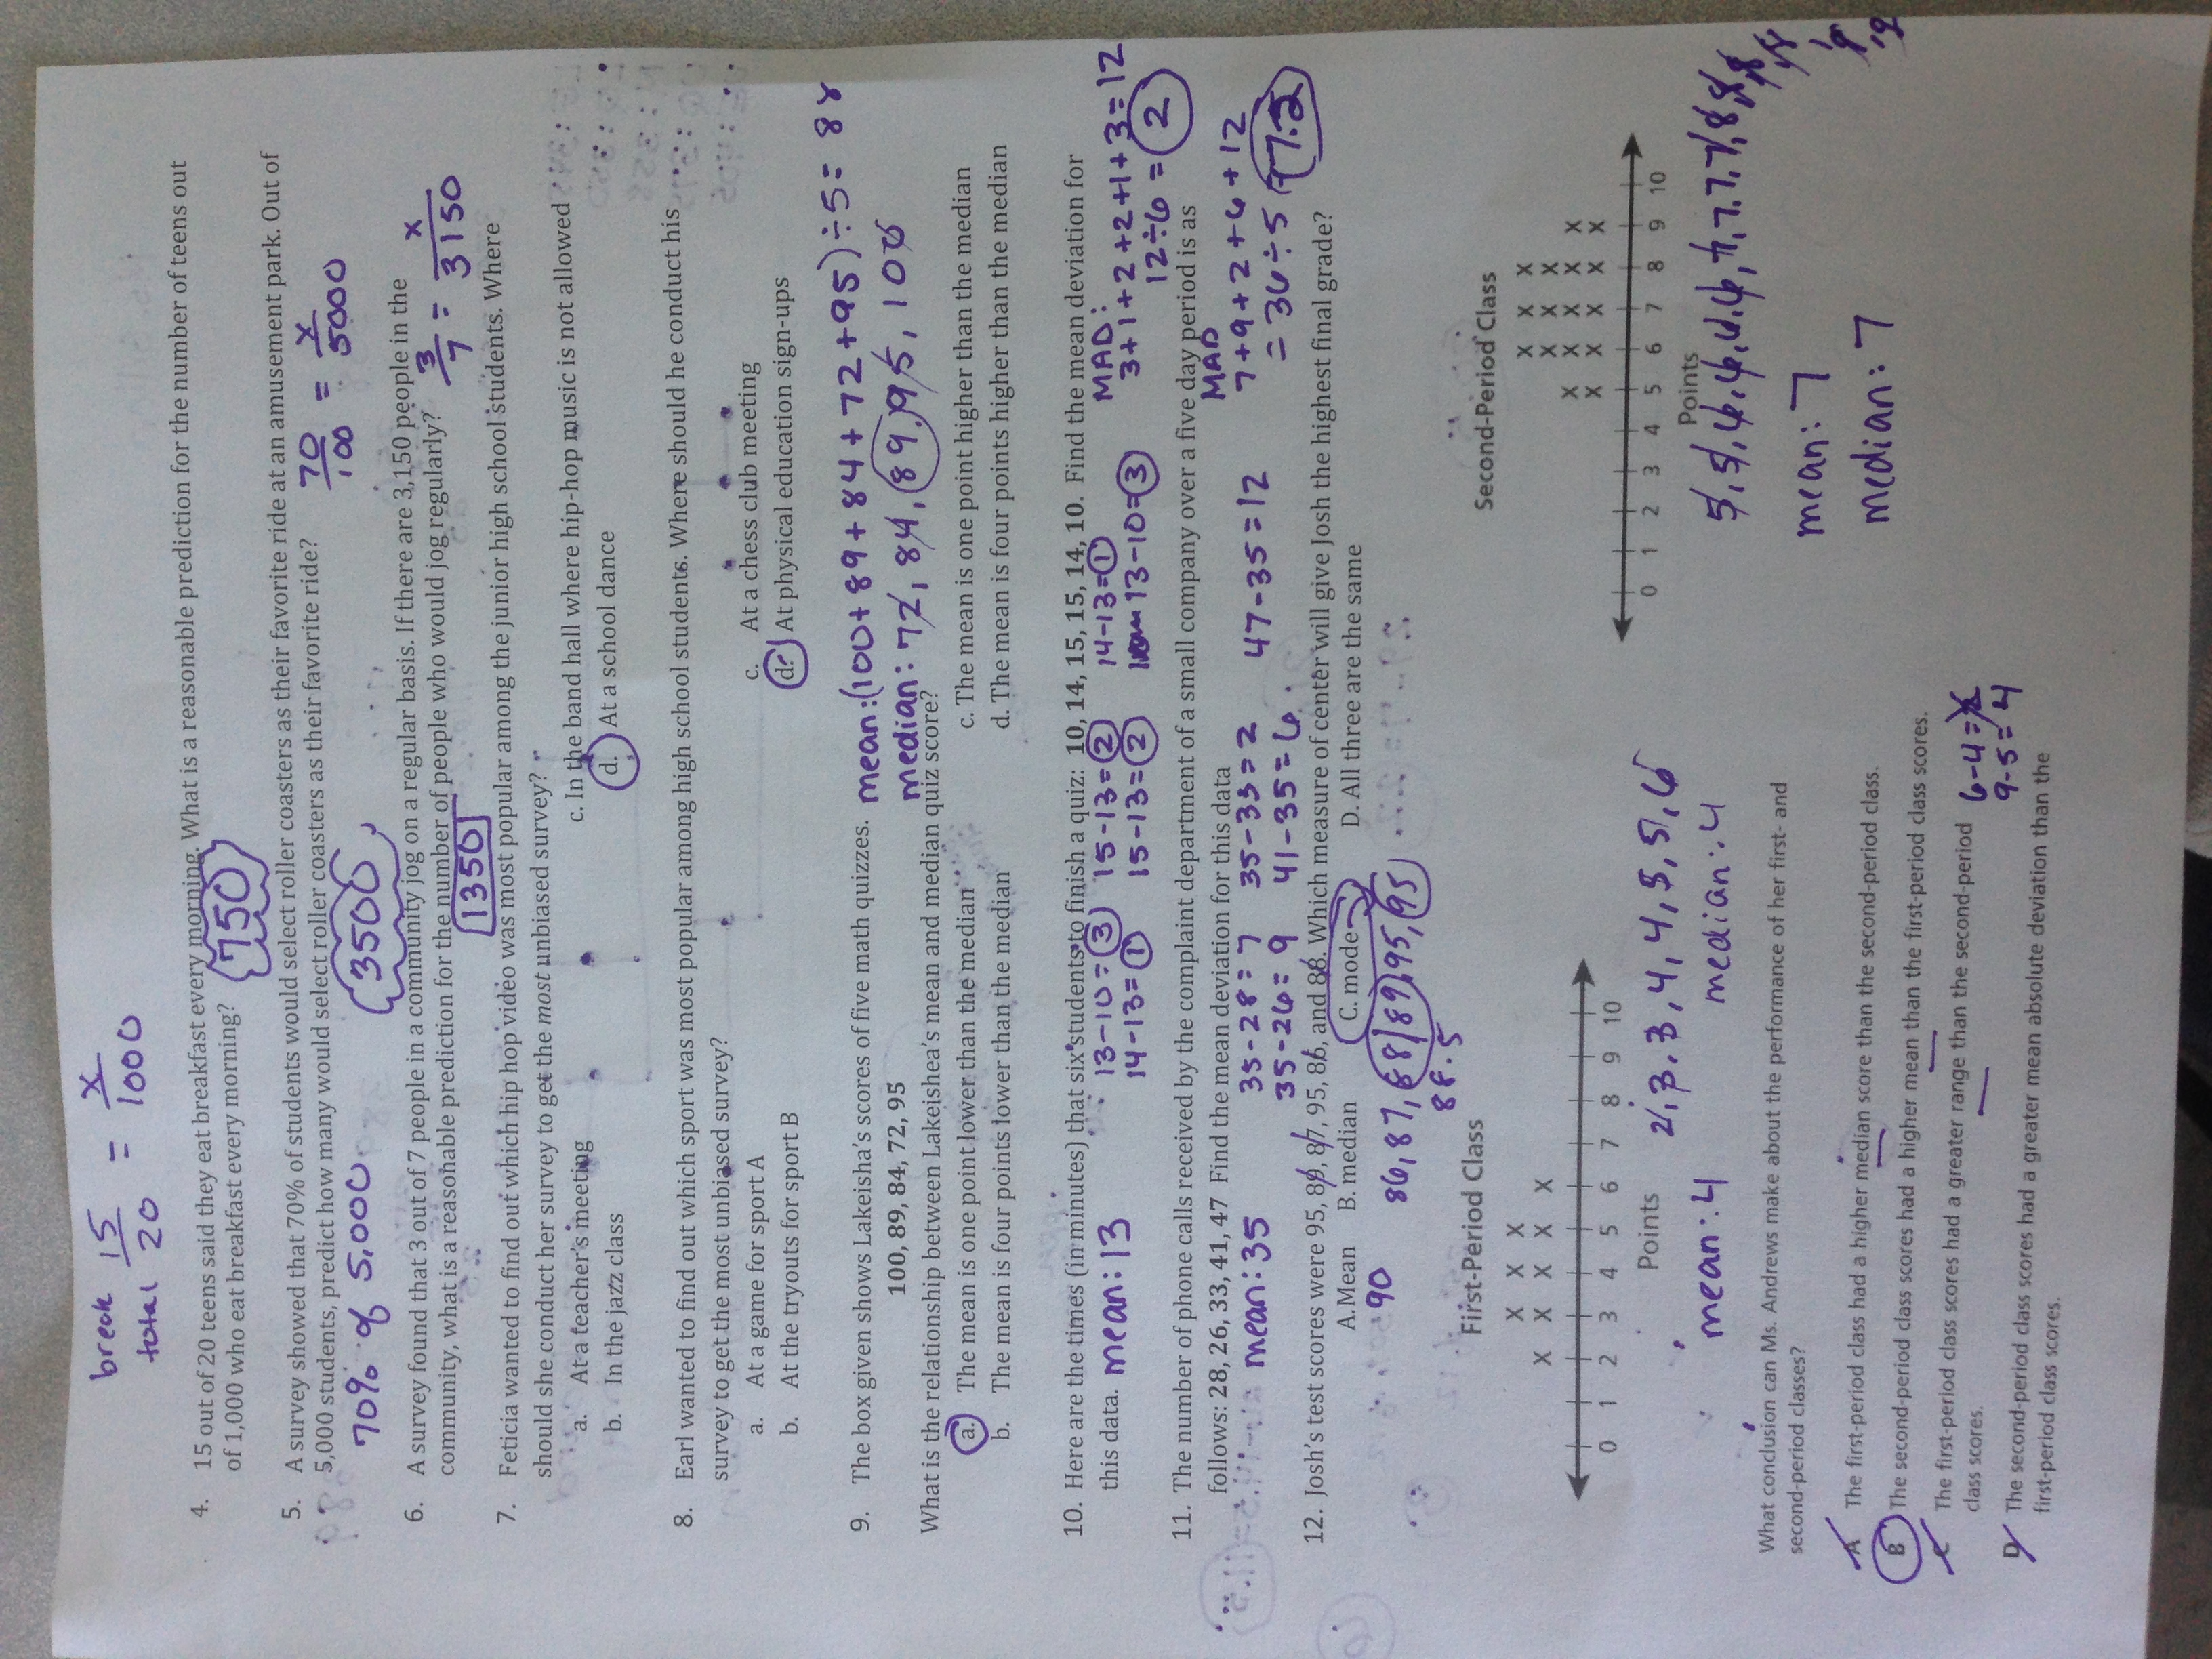
Test Review Answers Page 1
Test Review Answers Page 2
IXL offers extra practice questions for each standard covered: (Click the green links)
7.sp.1,2,3,4
Test Review
Test Review Answers Page 1
Test Review Answers Page 2
IXL offers extra practice questions for each standard covered: (Click the green links)
- 7.SP.A Use random sampling to draw inferences about a population.
- 7.SP.A.1 Understand that statistics can be used to gain information about a population by examining a sample of the population; generalizations about a population from a sample are valid only if the sample is representative of that population. Understand that random sampling tends to produce representative samples and support valid inferences.
- 7.SP.A.2 Use data from a random sample to draw inferences about a population with an unknown characteristic of interest. Generate multiple samples (or simulated samples) of the same size to gauge the variation in estimates or predictions.
- 7.SP.B Draw informal comparative inferences about two populations.
- 7.SP.B.3 Informally assess the degree of visual overlap of two numerical data distributions with similar variabilities, measuring the difference between the centers by expressing it as a multiple of a measure of variability.
- 7.SP.B.4 Use measures of center and measures of variability for numerical data from random samples to draw informal comparative inferences about two populations.
- Calculate mean, median, mode, and range (Seventh grade - AA.1)
- Interpret charts to find mean, median, mode, and range (Seventh grade - AA.2)
- Mean, median, mode, and range: find the missing number (Seventh grade - AA.3)
- Changes in mean, median, mode, and range (Seventh grade - AA.4)
- Interpret Box and Whisker Plots