|
701 & 716 were given a practice book 3 to complete. MUST DO AT LEAST the first and the last question. The rest will be done in class if not over the weekend
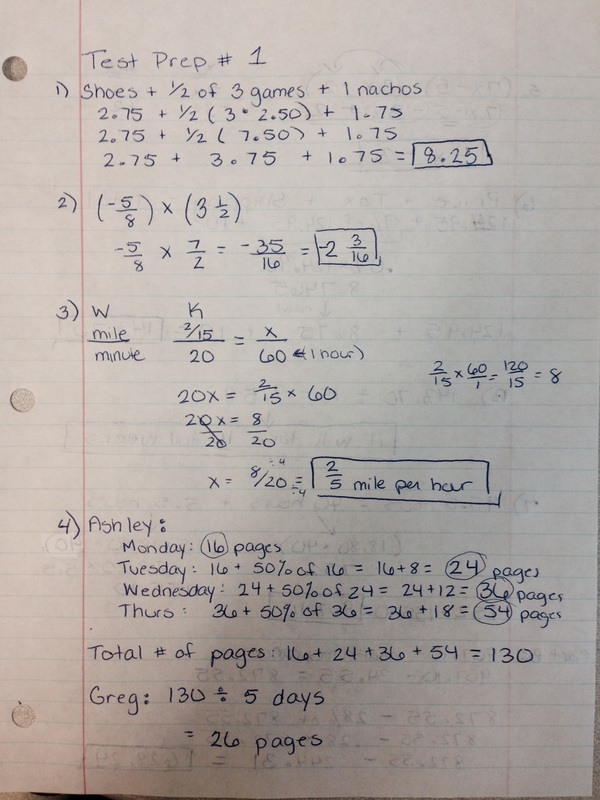
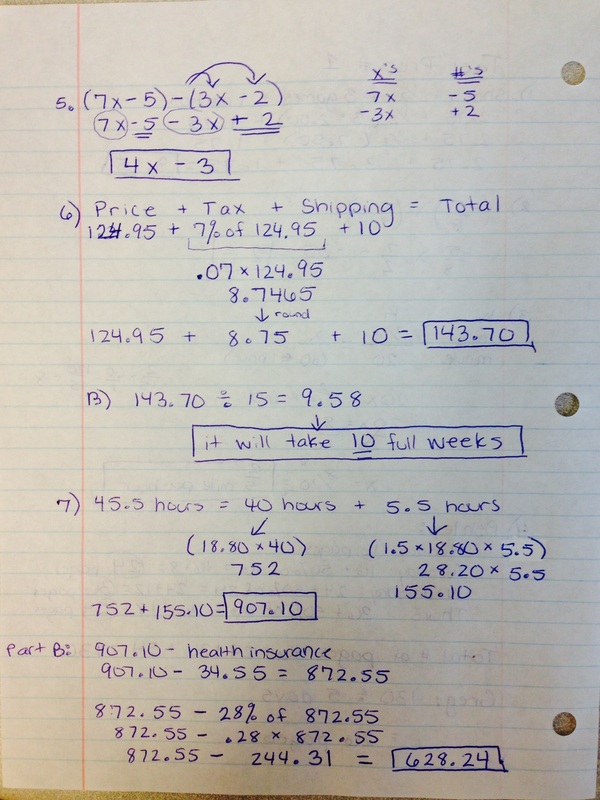
715 were given 16 questions from a Book 1. The questions are below as well as the answers to the whole test explained in a video. EVERYONE SHOULD LOOK AT THIS FOR EXTRA HELP!! Click here to open another copy of the Test Prep Packet When you finish the packet, go through the answer key below. Highlight the problems you still need to go over. (Remember there is always more than 1 way to get the right answer!) Look out for any mistakes I may have made - might earn you extra credit :) All students received a folder filled with all work that will be due from now until after spring break. Please make sure all work is completed according the schedule in the folder. (Obviously - work can be done earlier then due as well) Copy of Test Prep #1 Answers:
701 Test Monday
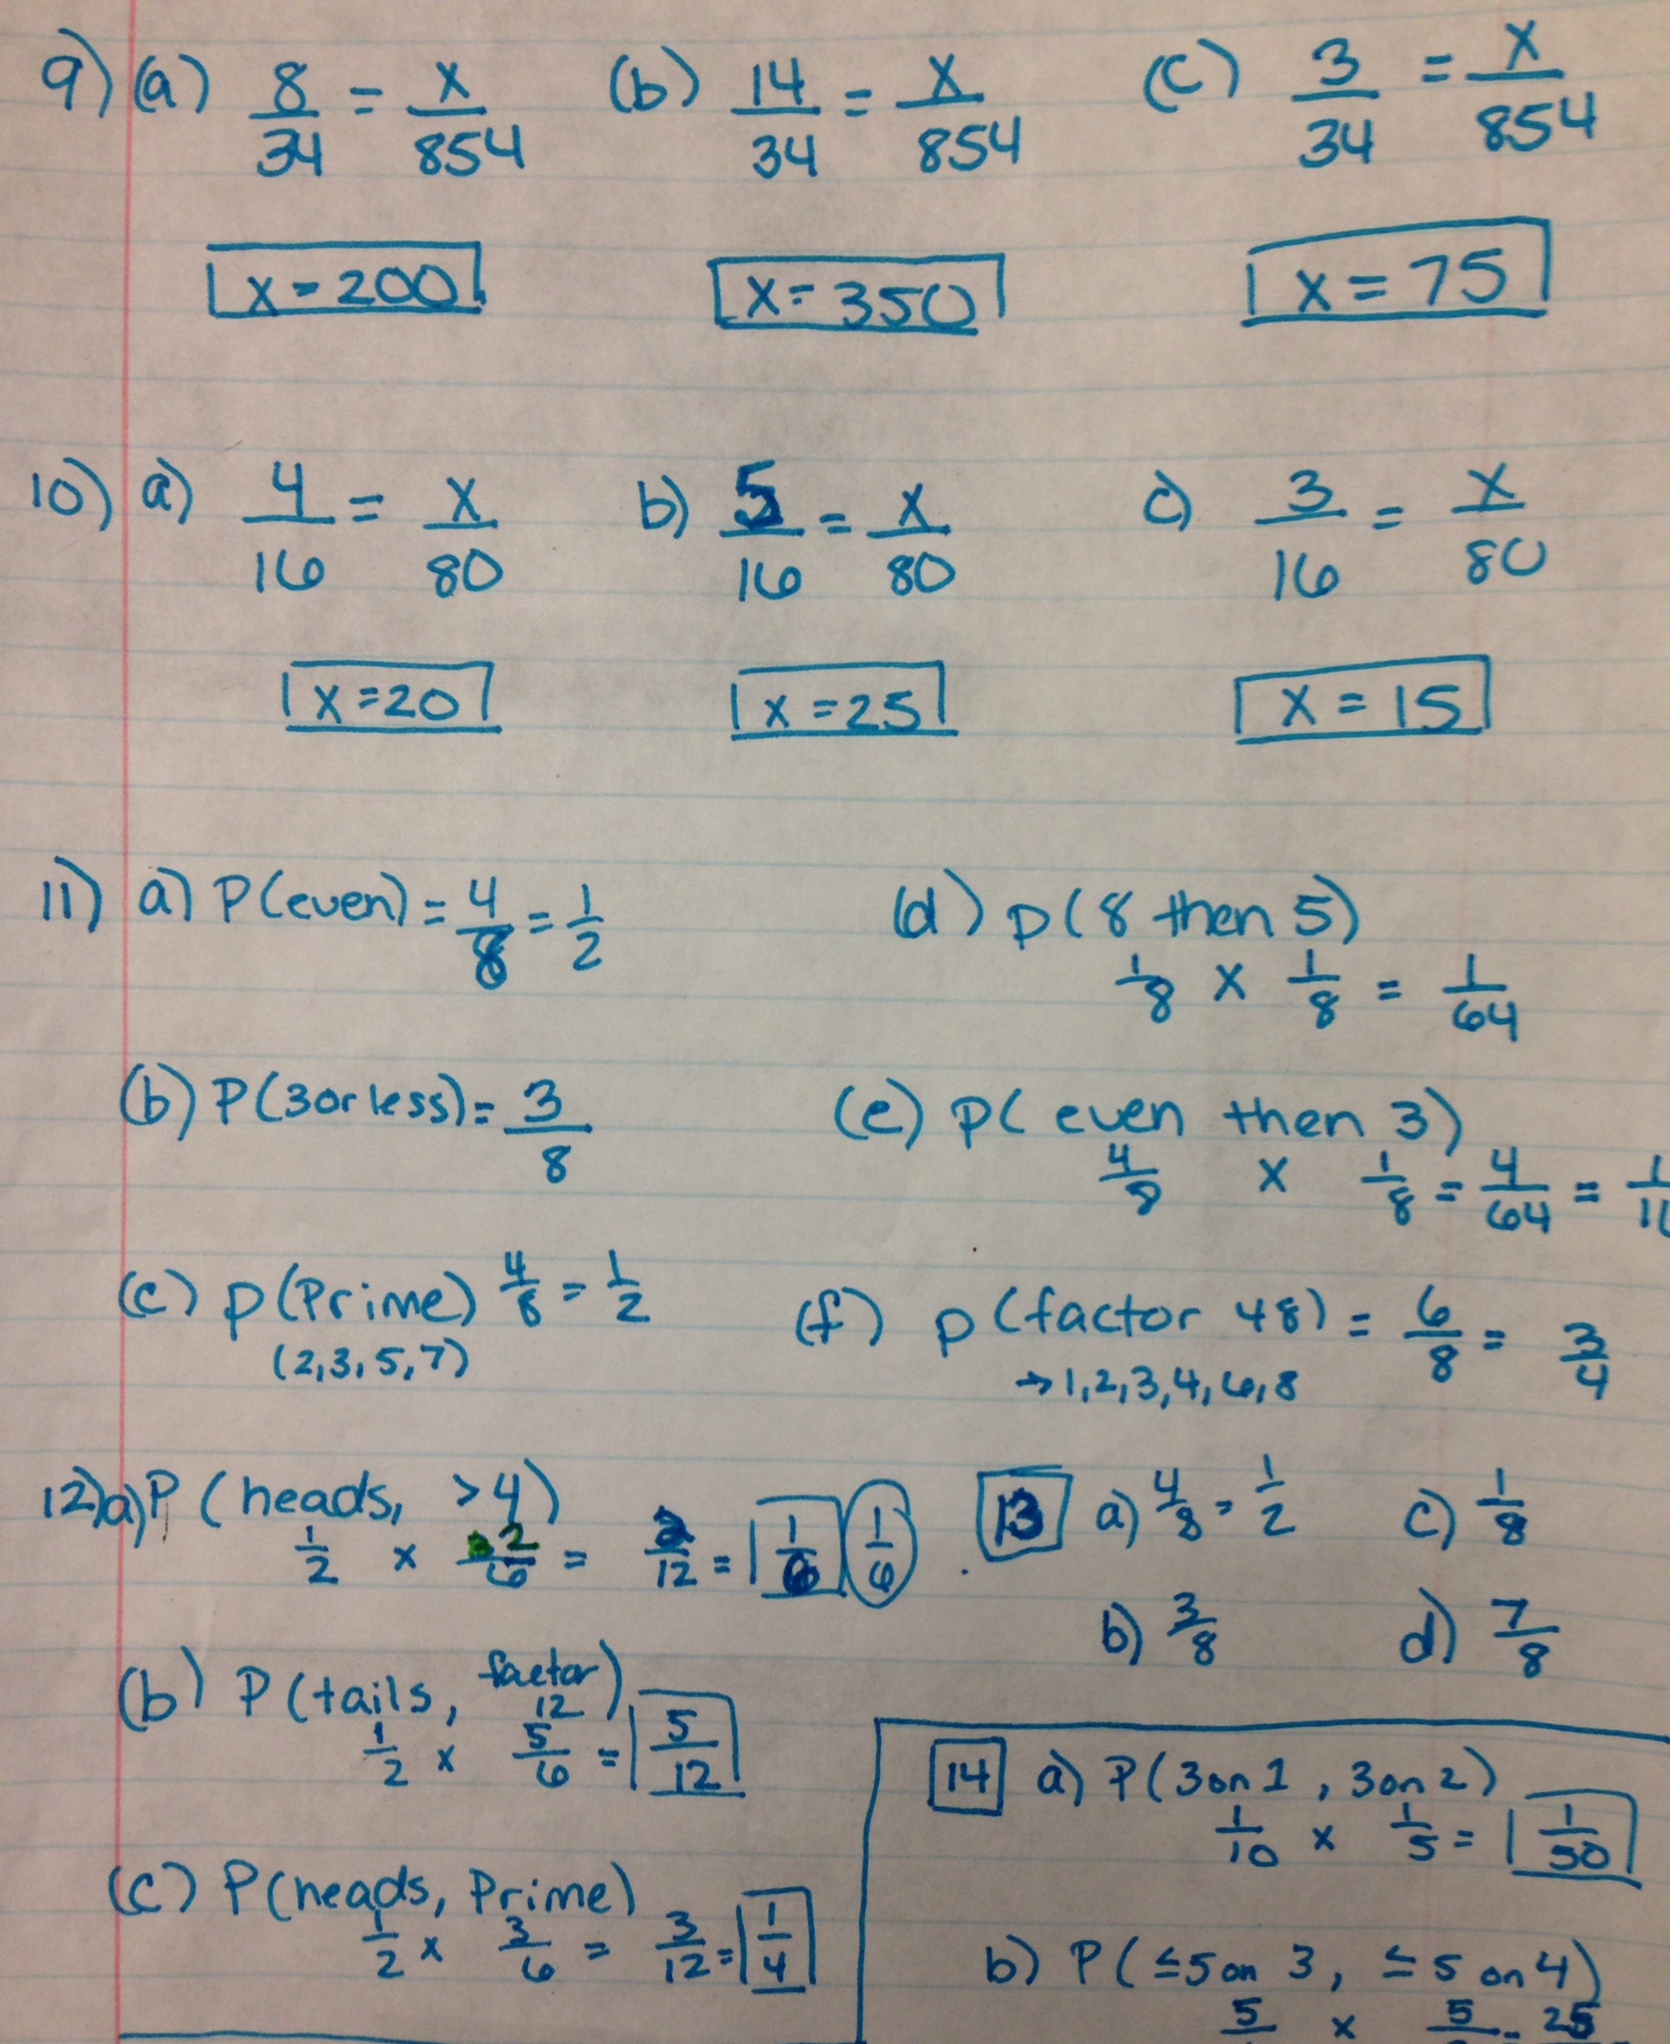
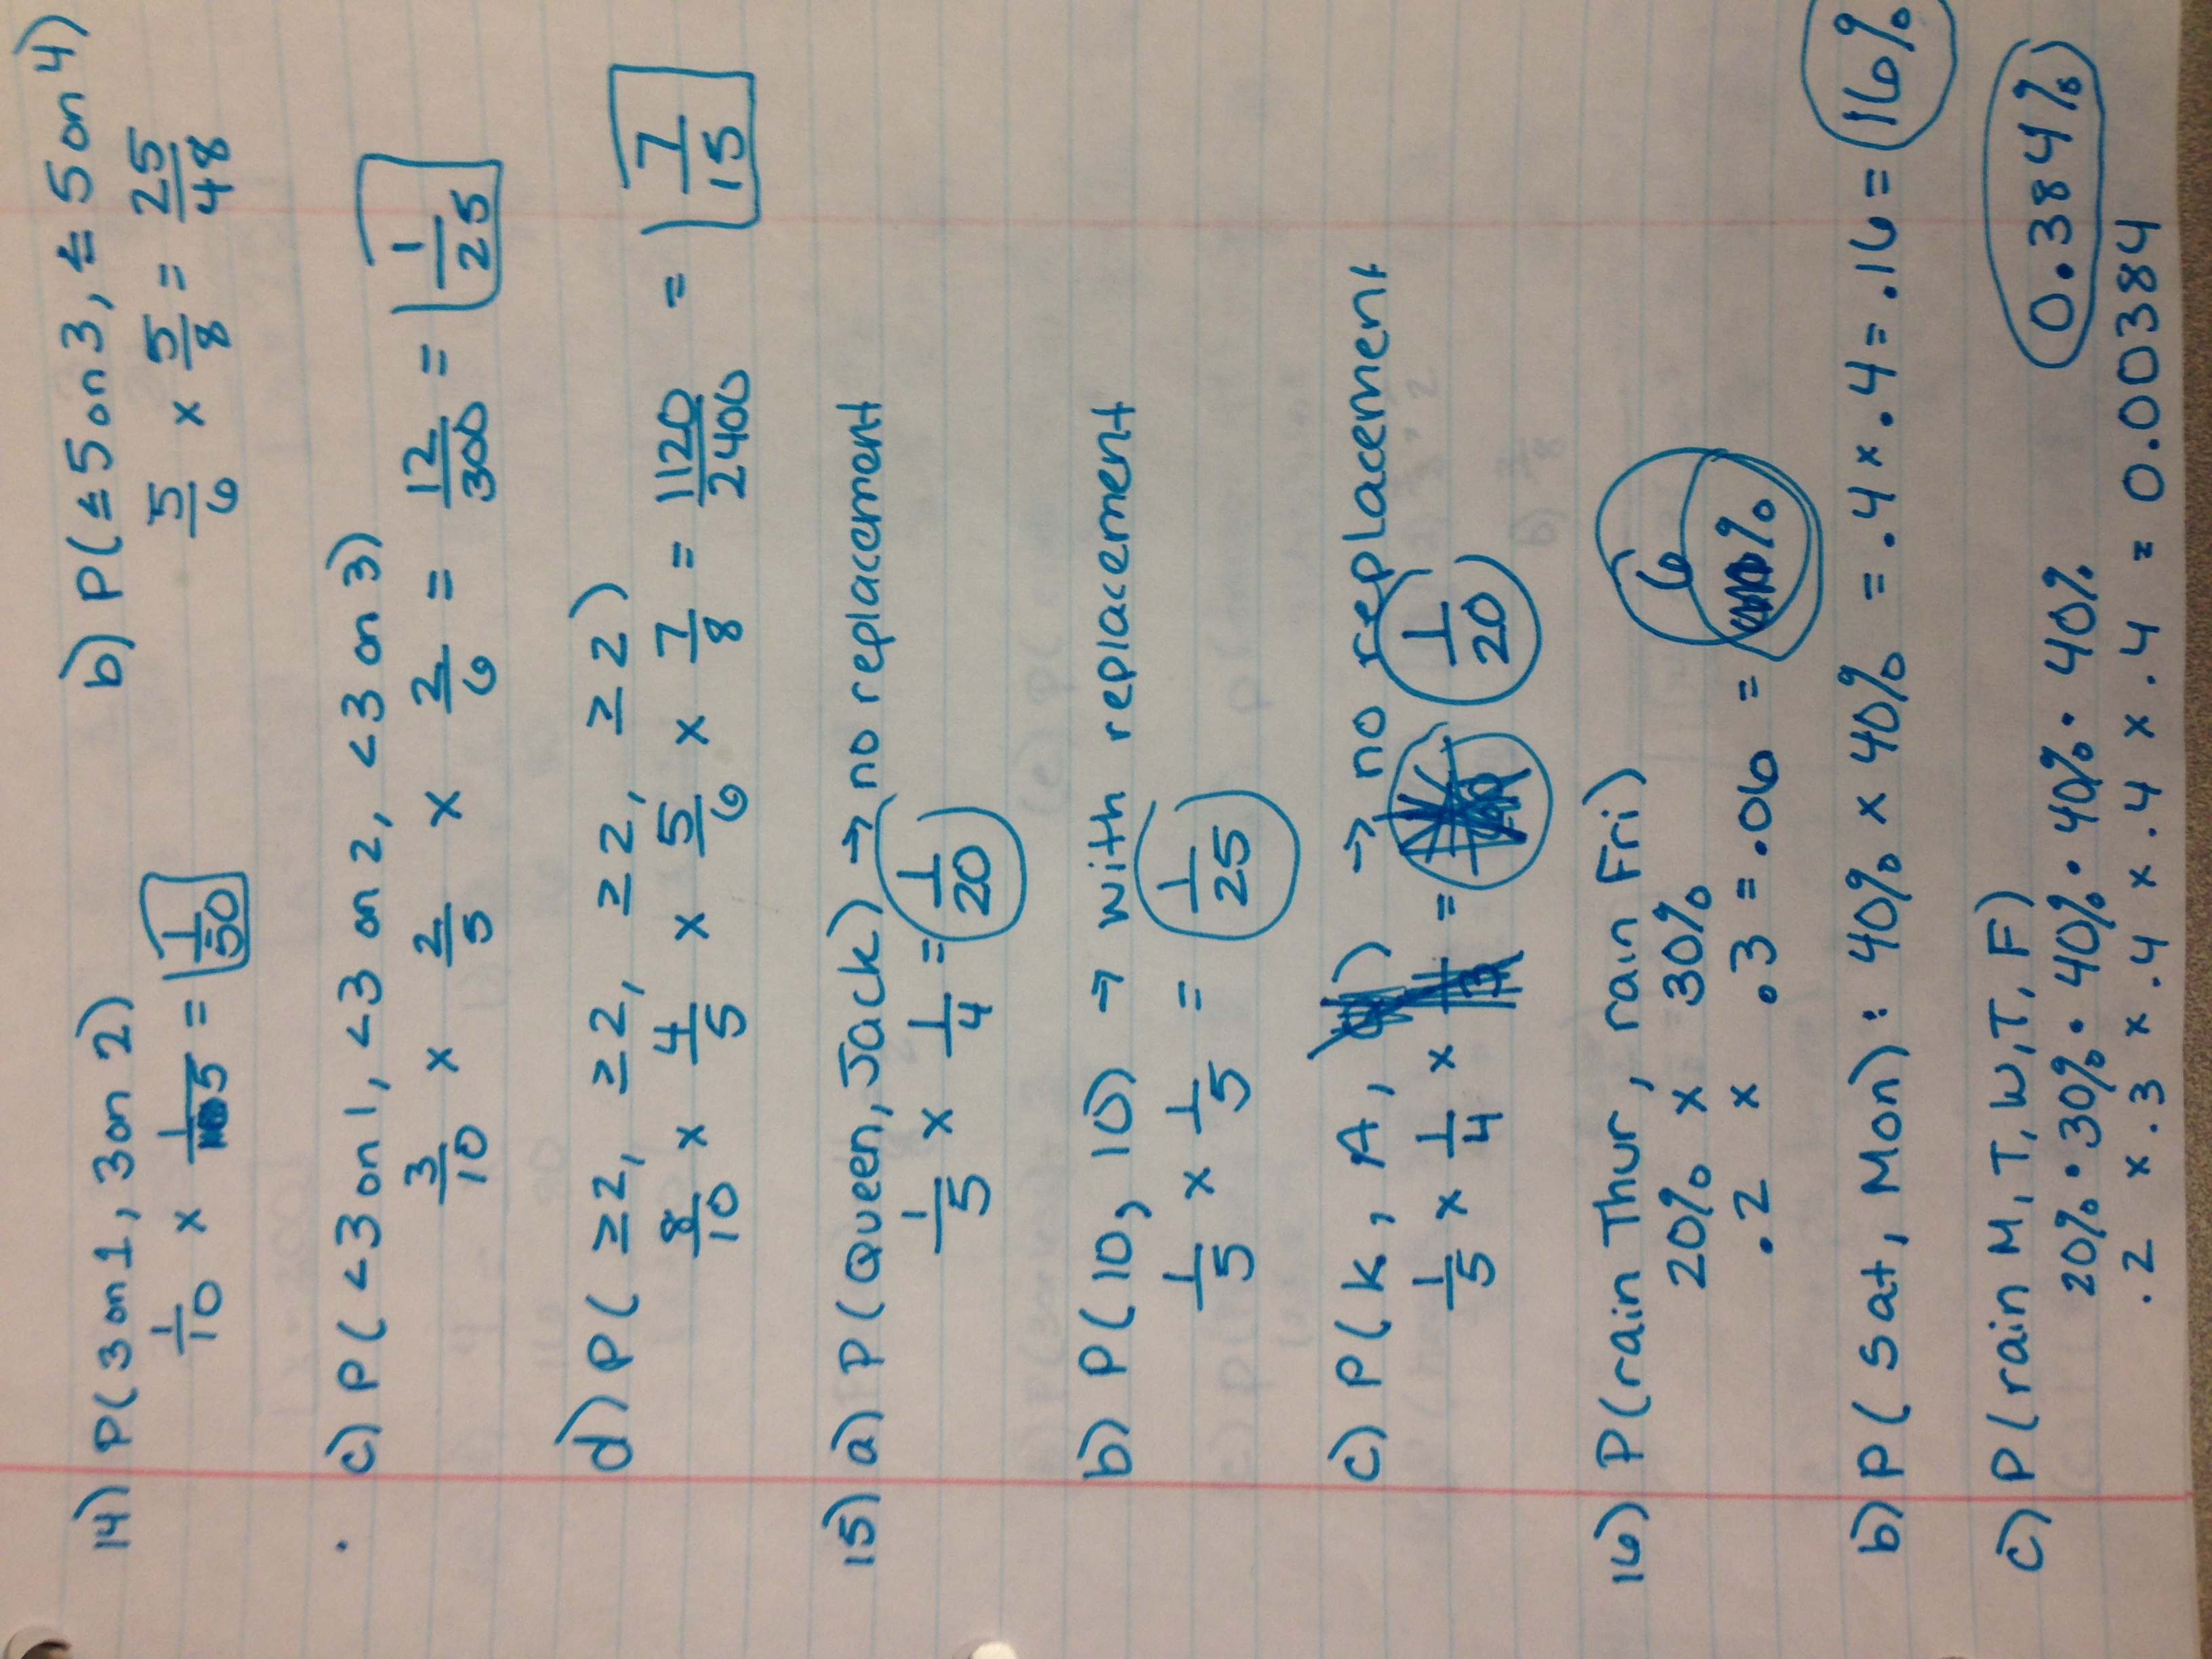
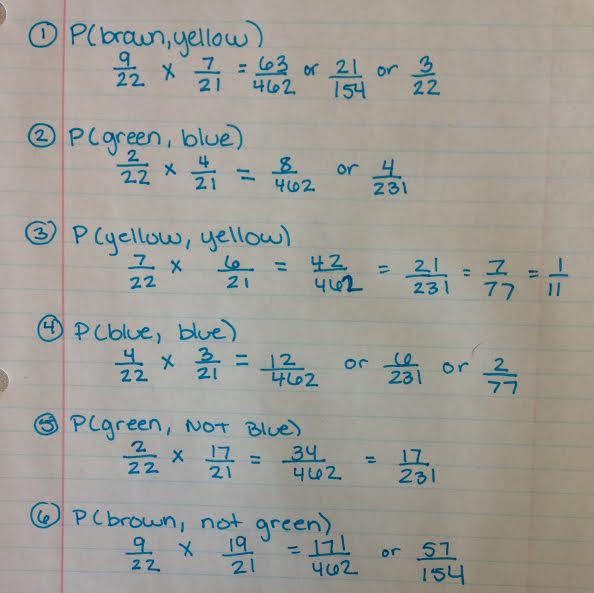
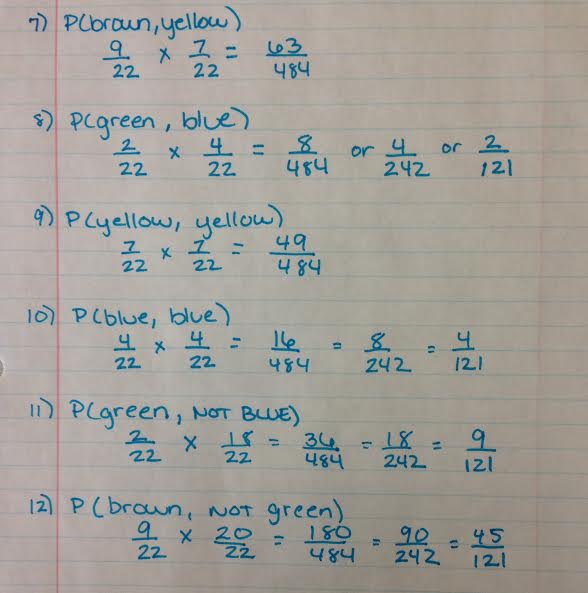
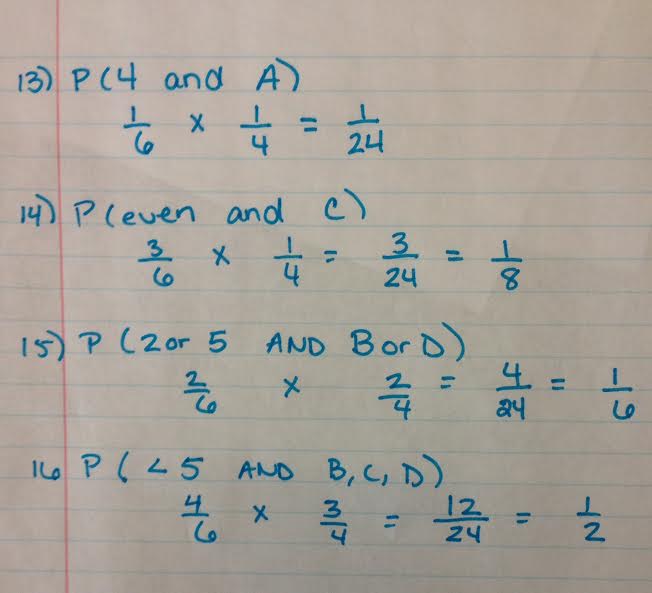
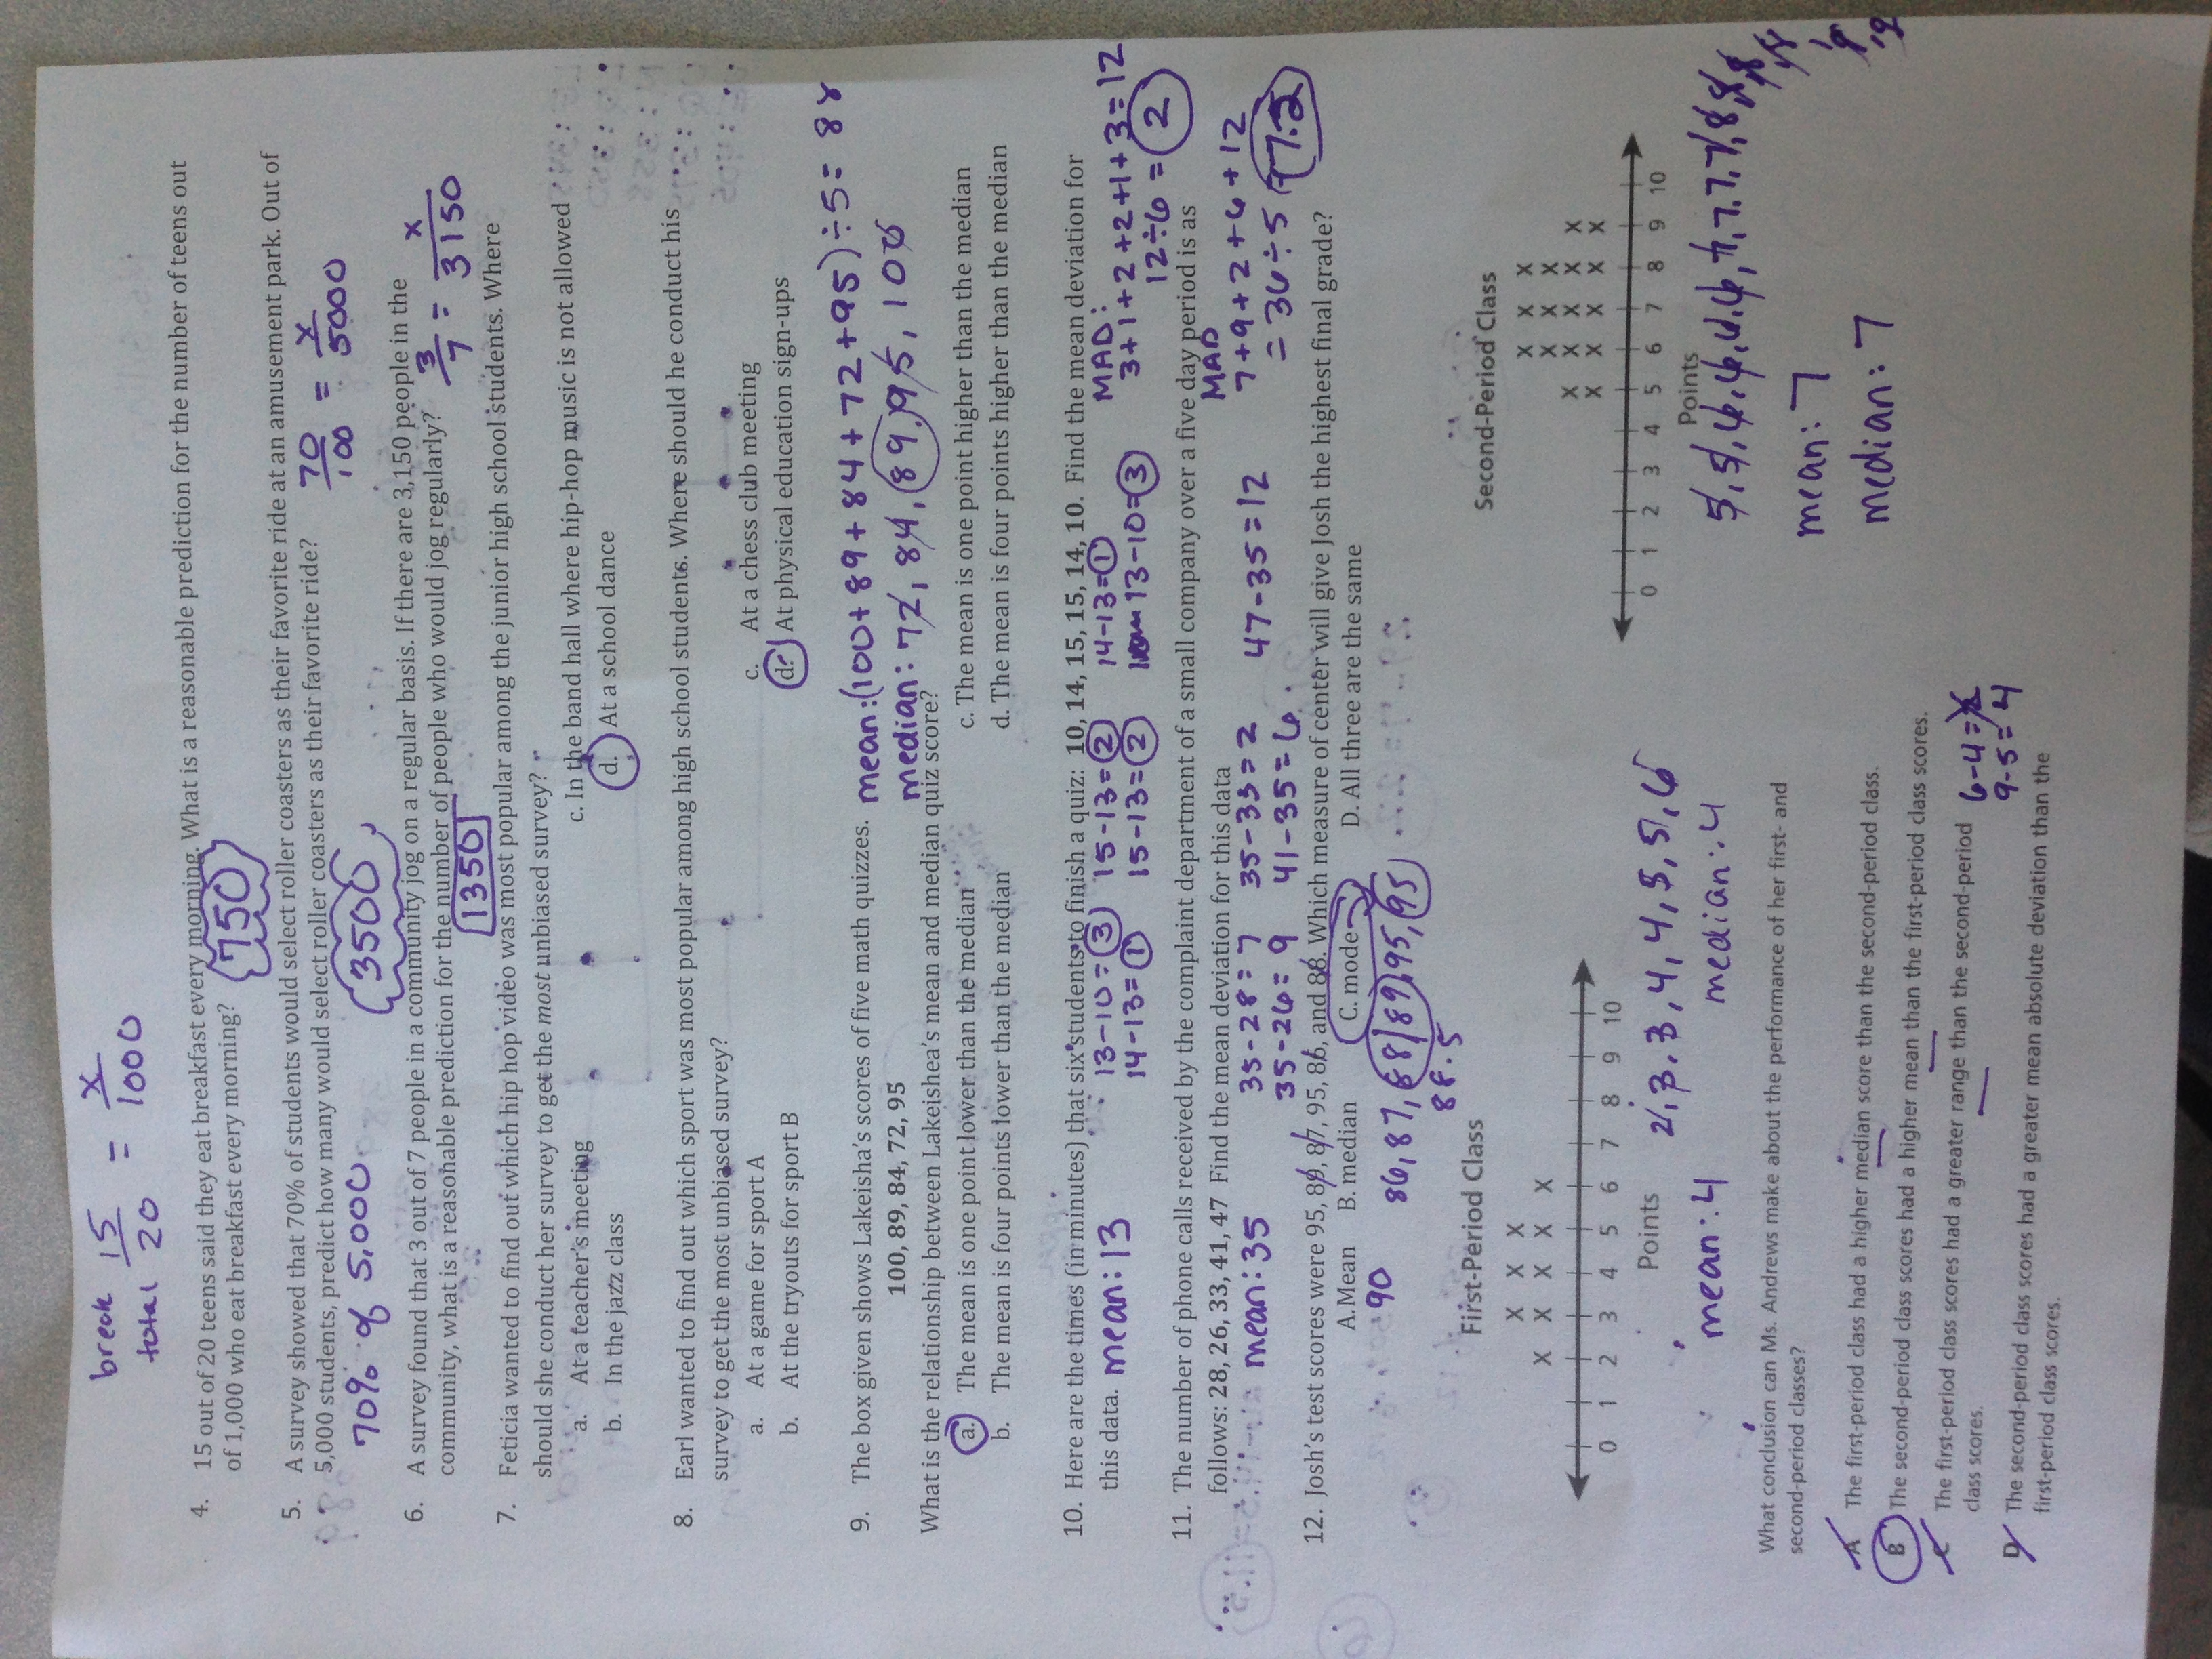
715/716 Test Tuesday Study Guide (with answers) Answers to 9-13 on study guide Answers 14-16 on study guide Test: 701 Monday 3/23 715&716: Tuesday 3/24We have been finishing up probability in class. 715: Homework: Compound Probability HW Answers1-6 Answers 7-12 Answers 13-16 716/701 (and 715 will receive a copy tomorrow): TEST STUDY GUIDE!!! If you keep practicing this paper and go over all of it - you will do very well!! The answers are at the bottom. I will post my work with answers tomorrow. Notes from Class: Review for Test on Monday (701) /Tuesday (715/716)
7.sp.1,2,3,4 Test Review Test Review Answers Page 1 Test Review Answers Page 2 IXL offers extra practice questions for each standard covered: (Click the green links)
Today we discussed box and whisker plots Click here for a copy of the homework Click here for the tutorial we watched in class for extra help. 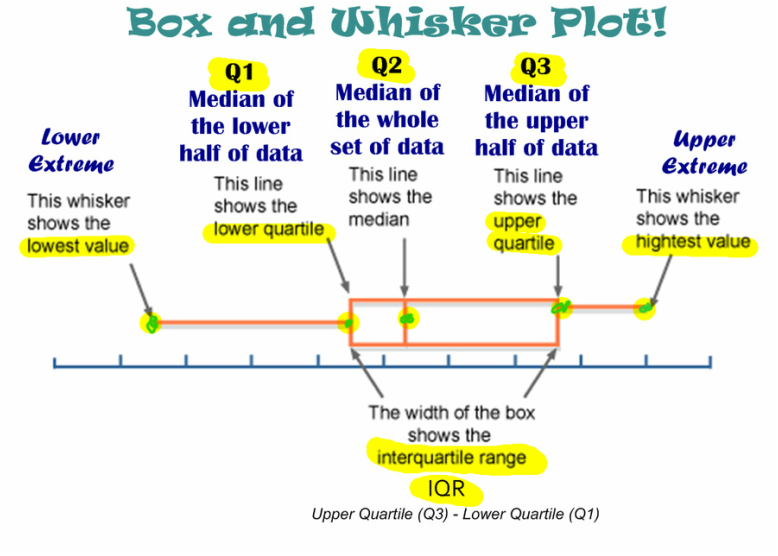
Homework: Find the mean absolute deviation (MAD) of 1) Morning Class Scores: 96, 76, 90, 88, 90, 93, 79, 80, 82, 86 2) Afternoon Class Scores: 70, 78, 80, 78, 86, 90, 76, 72, 70, 79 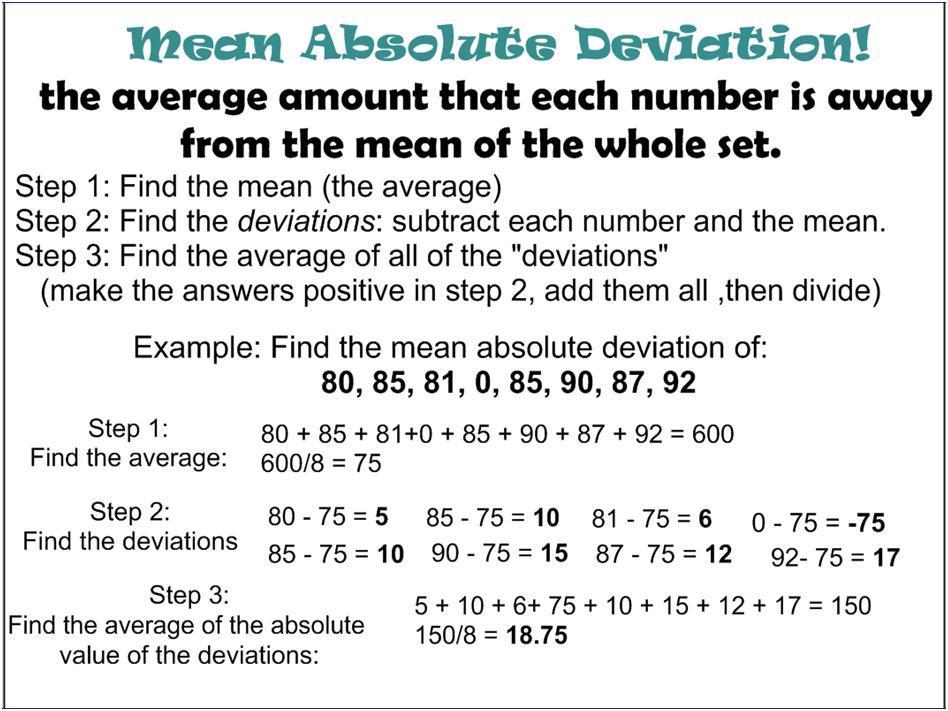 Mean Absolute Deviation from Maisonet Math on Vimeo. The past few days we have been talking about statistics. More importantly - we have been identifying if population samples produced biased or unbiased results. If they were valid, we were able to make predictions using proportions and percents.
Here are some videos to help you understand each standard better: Videos for 7.SP.1 – Understand that statistics can be used to gain information about a population by examining a sample of the population; generalizations about a population from a sample are valid only if the sample is representative of that population. Understand that random sampling tends to produce representative samples and support valid inferences. Videos for 7.SP.2 – Use data from a random sample to draw inferences about a population with an unknown characteristic of interest. Generate multiple samples (or simulated samples) of the same size to gauge the variation in estimates or predictions. For example, estimate the mean word length in a book by randomly sampling words from the book; predict the winner of a school election based on randomly sampled survey data. Gauge how far off the estimate or prediction might be. Copy of worksheets from class |